Case 06 · Boise State University · January 2014–January 2017
Building a lab—and developing its researchers
Role: Assistant Professor, Organizational Performance & Workplace Learning | Founder, iPerform Research Lab
Briefing
Developing research capability among students with limited prior research experience while delivering active projects.
Team scope
The lab reached a peak of 22 student researchers, averaging approximately six students per semester. Student researchers reported to me; faculty and industry collaborators participated as partners.
Funding
PI or Co-PI on five funded projects with combined awards totaling $317,600.
Amounts represent total project awards, not a personal share or an allocation solely to the lab. Award periods extend beyond my January 2017 role end date.
Context
I established the lab to give students research experience, advance my own research agenda, and create a dedicated research space for a department that historically lacked one. Its purpose was to put people’s experiences at the center of technology development.
My role
I established the staffing, research priorities, partnerships, facilities, funding, and operating practices, seeking mentorship from others who had built similar labs.
Developing researchers through active projects
I organized educational-research training around the semester, teaching weekly topics that coincided with students’ group-project assignments. Students learned methods in the context of research they were actively undertaking.
Returning and more experienced students mentored newer researchers, while doctoral students took on greater responsibilities. I reviewed the work due each week and provided instructional feedback, combining shared learning with direct oversight of research quality.
- Weekly instruction aligned with project assignments
- Peer mentoring and increasing responsibility
- Weekly faculty review and instructional feedback
Example
From first-year student to research contributor
David R. Flores joined as a first-year undergraduate willing to learn research. I taught him research methods and guided his participation in a Blackboard usability project. David drafted the research materials and collected the data; I conducted the data analysis. We coauthored a poster documenting the study while it was still in progress.
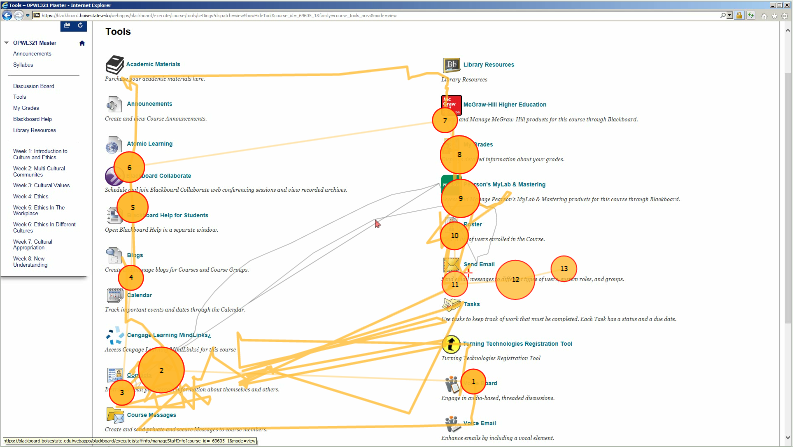
The project examined how students navigated Blackboard course sites, combining task observation, surveys, eye tracking, and facial-expression recording.
The Flores–Conley poster represents an earlier phase of the work and reports preliminary observations (n=30). That work later informed the published Blackboard course-layout study, which reports n=28.
From the poster “Usability Study for Designing Efficient Blackboard Course Sites” by David R. Flores & Quincy Conley. Reproduced without alteration.
Figure 4 · Study Setup
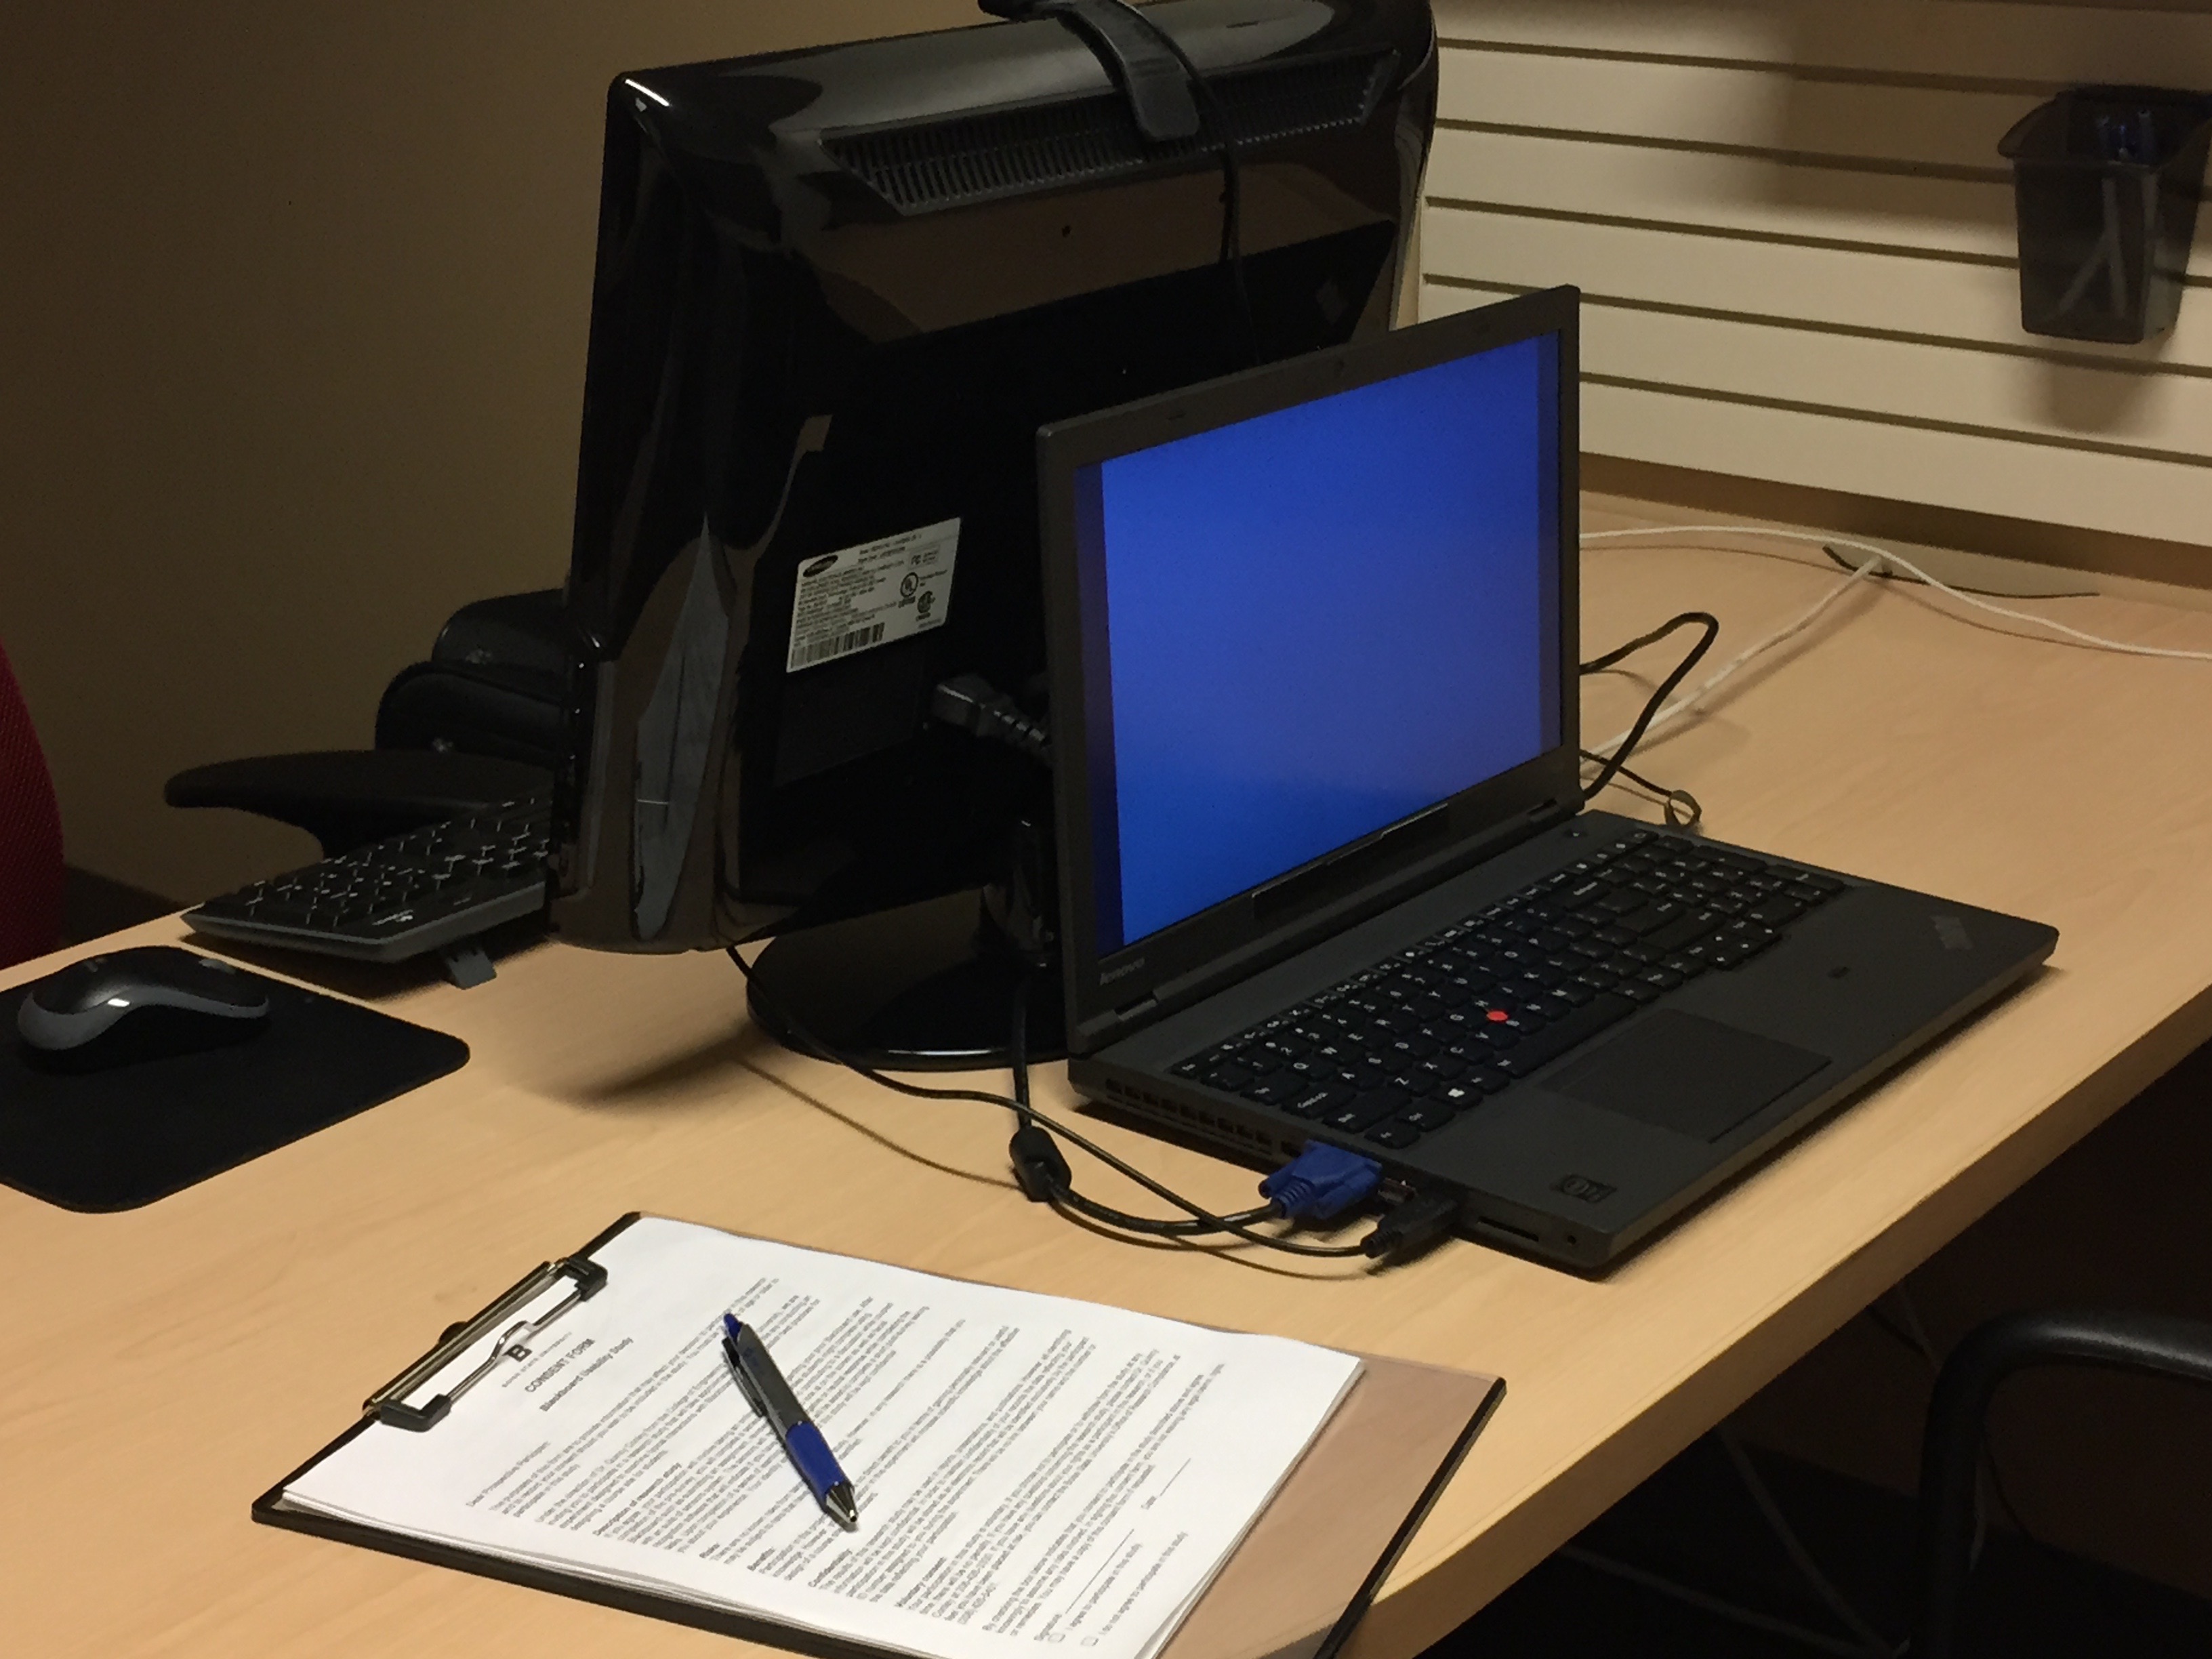
Figure 7 · Email Search Gaze Plot
Publication
Conley, Q., Earnshaw, Y., & McWatters, G. (2020). International Journal of Human–Computer Interaction, 36(4), 373–385. First published online in 2019.
What we built or changed
Completed work included research on learning-management-system usability, digital literacy and accessibility, and evidence-based approaches to learning and performance.
Funding
PI or Co-PI on five funded projects with combined awards totaling $317,600.
Developing Digital Literacies Skills for College and the Workplace
$303,000 · PI · 2016–2018 · Idaho State Board of Education Division of Vocational Rehabilitation
Media Depiction Learner Experience Usability Study
$3,600 · Co-PI · 2016–2017 · Dimensional Mechanics
MediaShare Learner Experience Usability Study
$4,500 · PI · 2015–2016 · Pearson
Blackboard Usability Study for Instructors Research
$3,000 · PI · 2015–2016 · OPWL Research Institute
Mobile Augmented Reality for Validating Embodied Learning (MARVEL) Agents
$3,500 · PI · 2015–2016 · BSU CTL Investigating Student Learning Grant
Amounts represent total project awards, not a personal share or an allocation solely to the lab. Award periods extend beyond my January 2017 role end date.
What this demonstrates
- Function building
- Research leadership
- Innovation
- Human-centered technology